Information Visualization Is Just A Starting Point
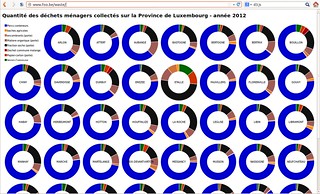
Information visualization is not an end but just a step to improve our understanding of data. Following a small discussion in the train about the visualisation of open data, I did a small experiment to analyse the statistics about the waste collection in my region. The result of this experiment is available along with some random notes. But the main question came from someone else looking at the visualization and basically told me: "I don't get it". He is right, the experimentation is just there to trigger more analysis (and sometime more visualization) with the objective to improve our understanding. Initially, the source of data is usually not analysed and sitting there waiting to be understood. Coming back to the data about waste collection, the initial discussion about the understanding or interpretation wouldn't be triggered if the first step of visualization is not done.
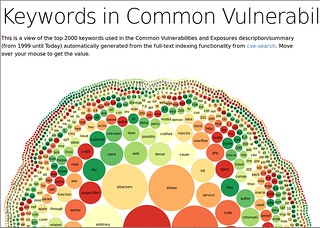
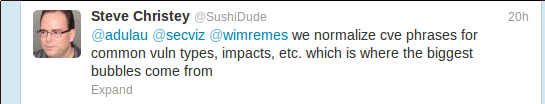
So in that scope, I tried a similar approach with a dataset I built from my cve-search tool. My idea was to see the terms used all the description of the Keywords in Common Vulnerabilities and Exposures (CVE). I did a first CVE terms visualization experiment and then I twitted about it. Then, this was triggering various explanations like why there is a predominance of some terms as commented by Steve Christey.
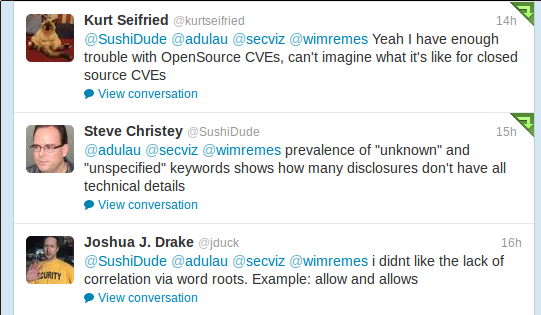
It clearly showed that is an iterative process especially to better understand the data. It's also an interactive process in order to improve the visualization and the data source. Following the good advise from Joshua J. Drake, I added a lemmatizer to keep only the root of each term and also exclude the standard English stopwords. With the visualization, we saw from some occurrences (e.g. unknown or unspecified) that the CVEs are based on incomplete information.
I'm quite sure that is not finished and just the beginning of more work and experiments in visualization. I read various books about information visualization but the result is often very static and you don't really see their iterative process to reach their visualization goals. Sometime, you just see a result without the process and the tools used to make the visualization happens.
At least with free software like D3.js, we have now a set of tools to understand how the visualization was built and maybe improve/discuss those visualizations. At least, if you want to play or improve the visualization of terms used for software vulnerabilities description, let me know.
You want an open mind, but not an empty head. Just because something is a new or fashionable alternative, doesn’t mean we need to get stupid when judging it. Edward Tufte.

