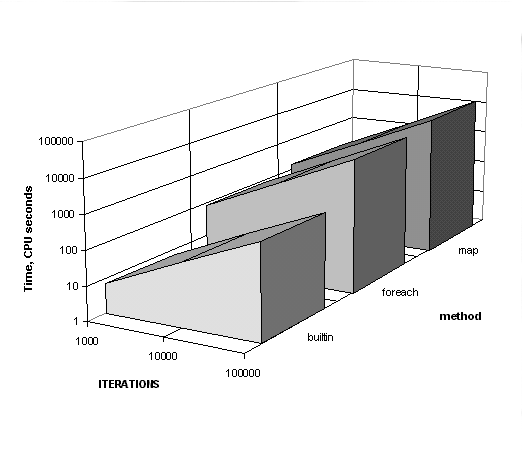
Figure 1: Total CPU time for three different
methods summing an array of 10,000 integers.
The "builtin"
method is significantly faster.
| Requirements |
|
Benchmark: Bundled with Perl
builtin: CPAN/modules/by-module/builtin |
Perl's motto is "There Is More Than One Way To Do It." Some ways are easy to read, some are fast, and some are just plain incomprehensible. Often I'll need to know how long it takes for my program to execute, and I'll use the Benchmark module to find out. Benchmark.pm comes with the standard Perl distribu-tion and is written completely in Perl, so you can use it right away.
Before I discuss the Benchmark module, let's think about what I must do to time an event. I need to know when the event started and when the event ended. If I know those I can determine the difference between them.
If I want to time one of my programs, I could use my stopwatch to time how long it takes to execute. If it takes more than several seconds I might actually be able to do that. However, I don't need my watch, since Perl already provides a way to do this with the built-in time() function, which returns the system time. I can record the system time twice and take the difference:
my $start_time = time;
# My code here
my $end_time = time;

my $difference = $end_time - $start_time;

print "My code took $difference seconds\n";
Since time() returns an integral number of seconds, this method can only record times and differences with one-second precision. That might be too coarse a granularity for the really fast code that I've written. Also, the CPU works on other things before it finishes my program, so the stopwatch approach doesn't tell me how long the CPU actually spent on my program. When the CPU is more heavily loaded, the time to execute might even be longer. A program might take ten seconds to execute but only use two seconds of actual CPU time.
The built-in times() function provides a list of the user time, system time, children's user time, and children's system time, all with a finer granularity than time(). Better still, it only records the time actually spent on my process - an important distinction for multitasking operating systems. I can use the same technique that I used before to time my program:
my @start_times = times;
# My code here
my @end_time = times;

my @differences = map { $end_time[$_] - $start_time[$_] }
                      (0..$#start_time);

my $difference = join ', ', @differences;
print " My code took ($difference) seconds\n";
But computers are pretty fast and that code might run a lot faster than the smallest time that I can measure, even with times(). To get around this I can run my code several times and compute the average. This makes the situation much more complicated. Not only I would need to make a loop to run the code several times, but I would need to figure out how the addition of the loop increased the time. But you don't have to worry about any of this if you use the Benchmark module.
Now I want to rewrite my previous examples using the Bench-mark module. To record a time, I construct a Benchmark object. The constructor creates a list of the times returned by time() and times(), although I don't need to worry about that since I just use the object-oriented interface.
use Benchmark;

my $start_time = new Benchmark;

# My code here
my @array = (1 .. 1000000);
foreach my $element ( @array ) { $_ += $element }

my $end_time = new Benchmark;
I also need a way to determine the time difference, which I can do with the timediff() function:
my $difference = timediff($end_time, $start_time);
This returns another Benchmark object. When I want to see the times that I have measured, I use the timestr() method:
print "It took ", timestr($difference), "\n";
This function provides several ways to print the time by using optional FORMAT and STYLE parameters, explained in the documentation embedded in the Benchmark module (type perldoc Benchmark or man Benchmark). After running this code I get:
It took 40 secs (17.53 usr 6.39 sys = 23.92 cpu)
The first number, 40 seconds, is the real time it took to execute exactly what my stopwatch would have revealed. The module takes this directly from time(). The next numbers are the values from times() giving the user and system times, which, when summed, give the total CPU time.
I can also measure the time it takes to perform several iterations of the code by using the timeit() method, which takes either a code reference (a reference to an anonymous subroutine) or a string. The function returns a Benchmark object that I can print as before.
#!/usr/bin/perl
use Benchmark;

my $ITERATIONS = 1000;

my $code = <<'CODE';
foreach my $element ( 1 .. 1000 ) { $_ += $element }
CODE

my $time = timeit($ITERATIONS, $code);

print "It took ", timestr($time), "\n";
On my computer, this program prints:
It took 14 secs ( 8.49 usr 0.00 sys = 8.49 cpu)
CAUTION! Do not compare benchmarks of code references and strings! Use the same for each technique that you compare since there is extra overhead with the eval() needed to benchmark a string. This is true for timeit() and all of the Benchmark functions.
As I mentioned before, running a snippet of code several times has additional overhead unrelated to the speediness of my code - the time required to set up the loop constructs, for instance. One of the advantages of the Benchmark module is that timeit() tests how long it takes to execute an empty string and subtracts that time from the time to run your code; this compensates for the extra overhead introduced by the act of benchmarking code. There are several methods that let you exert finer control over this feature; they're described in the documentation embedded in the module.
The function timethis() is similar to timeit(), but has optional parameters for TITLE and STYLE. The TITLE parameter allows you to give your snippet a name, and STYLE affects the format of the output. The results are automatically sent to STDOUT, although timethis() still returns a Benchmark object. Internally, timethis() uses timeit().
Now that I know how long it took to run my bit of code, I'm curious if I can make that time shorter. Can I come up with another way to do the same task, and, if I can, how does its time compare to other ways? Using the Benchmark module, I can use timeit() for each bit of code. However, the Benchmark module anticipates this need, providing a function that compares several chunks of code: timethese().
The timethese() function is a wrapper around timethis(). The %SNIPPETS hash contains snippet names as keys and either CODE references or strings as values. The function returns a list of Benchmark objects for each chunk of code.
my @benchmarks = timethese($ITERATIONS, \%SNIPPETS);
timethese() doesn't guarantee any particular order for testing the snippets, so I have to keep track of the order in which time-this() reports the results. If I wanted to do further programmatic calculations with the times, I could store the list returned by timethese(), but for now I will rely on the information printed from timethis(). Now I just need something to compare.
To demonstrate timethese(), I want to compare five different ways to sum an array. I gave each snippet a name based on my impression of it. The Idiomatic method is the standard use of foreach. Even if this technique turns out to be slower than another, I'd still prefer it because it's the most straight forward solution. The Evil use of map in a void context seems like it might be really clever and preferred by some Perl pedants, but how fast is it? The Builtin technique uses the sum() function from Graham Barr's builtin module, which uses XS to tie C code to a Perl function. I think Builtin might be very competitive. I expect the Curious and Silly methods to be very slow, but at the very least they'll make me appreciate the speed of the other techniques.
Idiomatic:
foreach (@array) { $sum += $_ }
Evil (use of map in void context)
map { $sum += $_ } @array;
Builtin:
$sum = sum @array;
Curious:
grep { /^(\d+)$/ and $sum += $1 } @array
Silly:
$_ = join 'just another new york perl hacker', @array_name;
while ( m/(\d+)/g ) { $sum += $1 }
Our program to test all five techniques:
#!/usr/bin/perl


use Benchmark qw(timethese);
use builtin qw(sum);

my $ITERATIONS = 10000;
@array = (1 .. 10);

my %SNIPPETS = (
  Idiomatic => ' $sum=0; foreach (@array) { $sum += $_ }',
  Evil => '$sum=0; map { $sum += $_ } @array',
  Builtin => '$sum=0; $sum = sum @array'
  Curious => '$sum=0; grep { /^(\d+)$/ and $sum += $1 } @array',
  Silly => q|$sum=0;
      $_ = join 'just another new york perl hacker', @array;
      while( m/(\d+)/g ) { $sum += $1 }|
);
timethese($ITERATIONS, \%SNIPPETS);
The surprising results:
Idiomatic: 1 secs ( 1.08 usr 0.00 sys = 1.08 cpu)
     Evil: 2 secs ( 1.44 usr 0.00 sys = 1.44 cpu)
   Builtin: 1 secs ( 0.24 usr 0.00 sys = 0.24 cpu)
           (warning: too few iterations for a reliable count)
   Curious: 8 secs ( 8.17 usr 0.00 sys = 8.17 cpu)
     Silly: 11 secs ( 7.26 usr 0.01 sys = 7.27 cpu)
The sum() function from builtin is very fast. In fact, it was so fast that for 10,000 iterations the Benchmark module couldn't measure a reliable time. The foreach loop is slightly faster than the "clever" use of map, but both are significantly slower than sum(). The other methods, which I never expected to be fast, are indeed quite slow.
However, this comparison doesn't satisfy me. What happens as the size of the array and the number of iterations changes? Over the past several weeks I ran several combinations of array size and iterations for each of the methods. Since I don't really care about the Curious and Silly methods, I only report the results for the Idiomatic, Evil, and Builtin methods. I ran each with arrays of sizes from 10 to 10,000 elements and iterations from 1000 to 1,000,000 times. The longest time took about 86,000 CPU seconds of a Sparc20 (96 Mb RAM, Perl 5.004) - that's about 1 CPU day! Don't try this without telling the system administrator what you are doing, especially if you called your script "test" - it's not fun to get email nastygrams from an administrator who thinks you have a script running amok when it's really doing exactly what you want it to do. Not that this happened to me and you can't prove it anyway.

Figure 1: Total CPU time for three different
methods summing an array of 10,000 integers.
The "builtin"
method is significantly faster.
Stopwatches aren't very effective for timing a piece of code because the CPU might work on other things before it finishes your task. The times() function is a little better, but my code might run faster than it can measure. I don't have to worry about these issues when I use the Benchmark module, which averages the time needed over many iterations.
In my summing example, I discovered that the "clever" use of map() was consistently slower than the idiomatic foreach, which in turn was much slower than sum(). Although foreach is the conventional way to sum an array, I am hard-pressed to justify the order of magnitude speed penalty - I'll be using sum() from now on. If you think that you have a faster method, you now have the tools to test it. If your method beats sum(), send me a note (and Graham too)!
__END__